Understand climate risks
Map vulnerabilities and risks to create an evidence base for action.
REGIONs4CLIMATE / GIS Story Maps
The Regions4Climate (R4C) project supports a socially just transition to climate resilience across 12 European regions by identifying climate risks, co-developing solutions, and showcasing them through interactive GIS Story Maps.
From EU-wide vulnerability mapping to regional action to real-world tested solutions.

Regions4Climate brings together 12 European regions to understand climate vulnerabilities, design tailored resilience solutions, and test them in real-world conditions. The project ensures that adaptation strategies are socially inclusive, place-based, and transferable across Europe while supporting a just transition to climate resilience.
Learn about the approachMap vulnerabilities and risks to create an evidence base for action.
Work with stakeholders to define place-based and inclusive responses.
Demonstrate locally attuned solutions in real-world regional conditions.
Make each region's climate journey accessible through interactive maps, narrative, images, and lessons learned.
The Regions4Climate (R4C) project supports a socially just transition to climate resilience across 12 European regions, including the Azores, Basque Country, South Aquitaine, Tuscany, Pärnumaa, Helsinki-Uusimaa, Burgas, Sitia, Castilla y León, Cyprus, the Nordic Archipelago, and Køge Bay.
The journey begins with vulnerability and risk maps developed by project partners. These interactive datasets provide a comparative view of climate risks across all Regions4Climate territories.
R4C’s approach starts with evidence. By mapping vulnerabilities and risks in each region, the project creates a clear foundation for action and decision-making. These insights guide the development of targeted, place-based solutions that address both environmental and socio-economic dimensions of climate change.
Each region follows this pathway—from understanding risks to implementing solutions—creating a portfolio of tested approaches that can be adapted and replicated elsewhere. The full journey of each region, including how solutions are designed and applied, can be explored through the GIS Story Maps.
Core platform explanation
GIS Story Maps combine interactive maps, narrative text, images, and multimedia to tell the full story of each region's climate journey - from risks to solutions.
They are the main output of the project, not just a visualization tool.
The EU-level vulnerability and risk maps identify where climate pressures are most significant. These insights guide the selection of local interventions in each of the 12 pilot regions where solutions are developed and tested.
Each selected region becomes a living case study, explored in depth through a GIS Story Map.
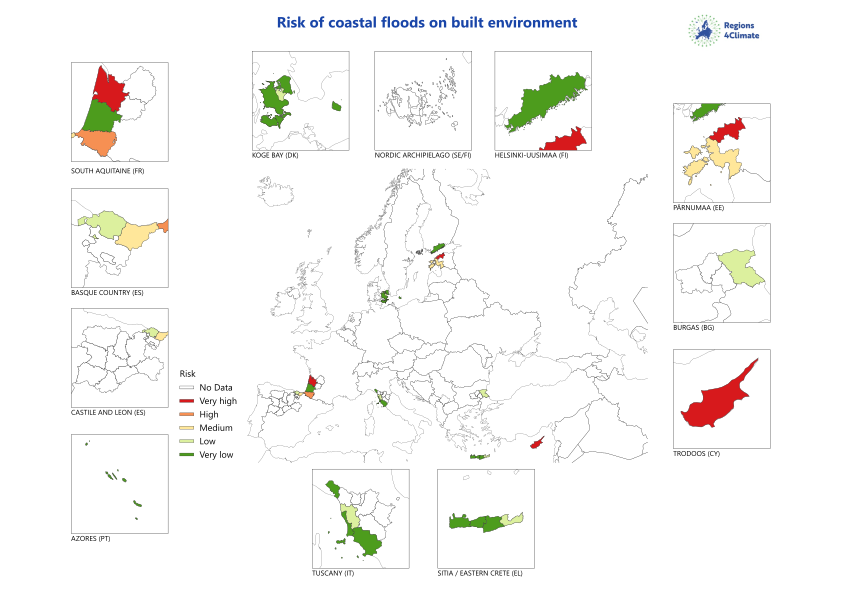
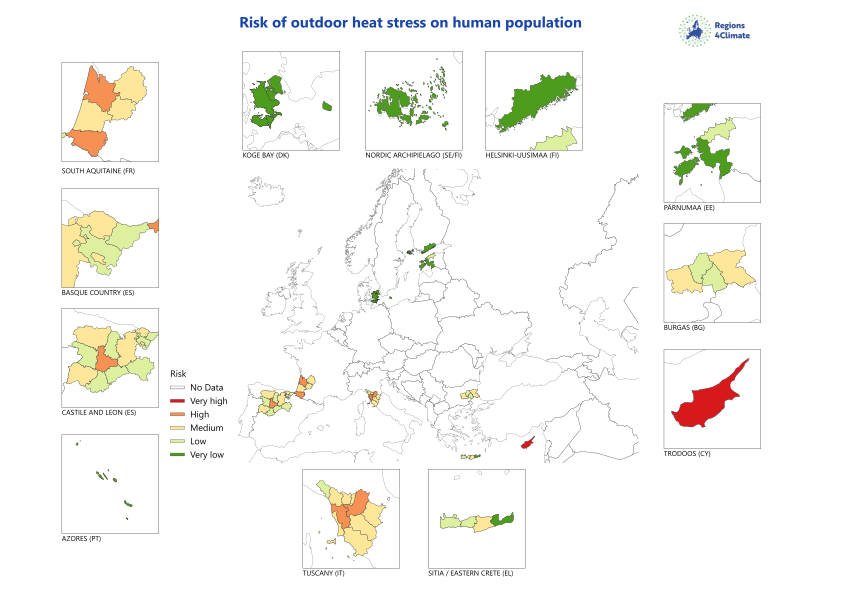
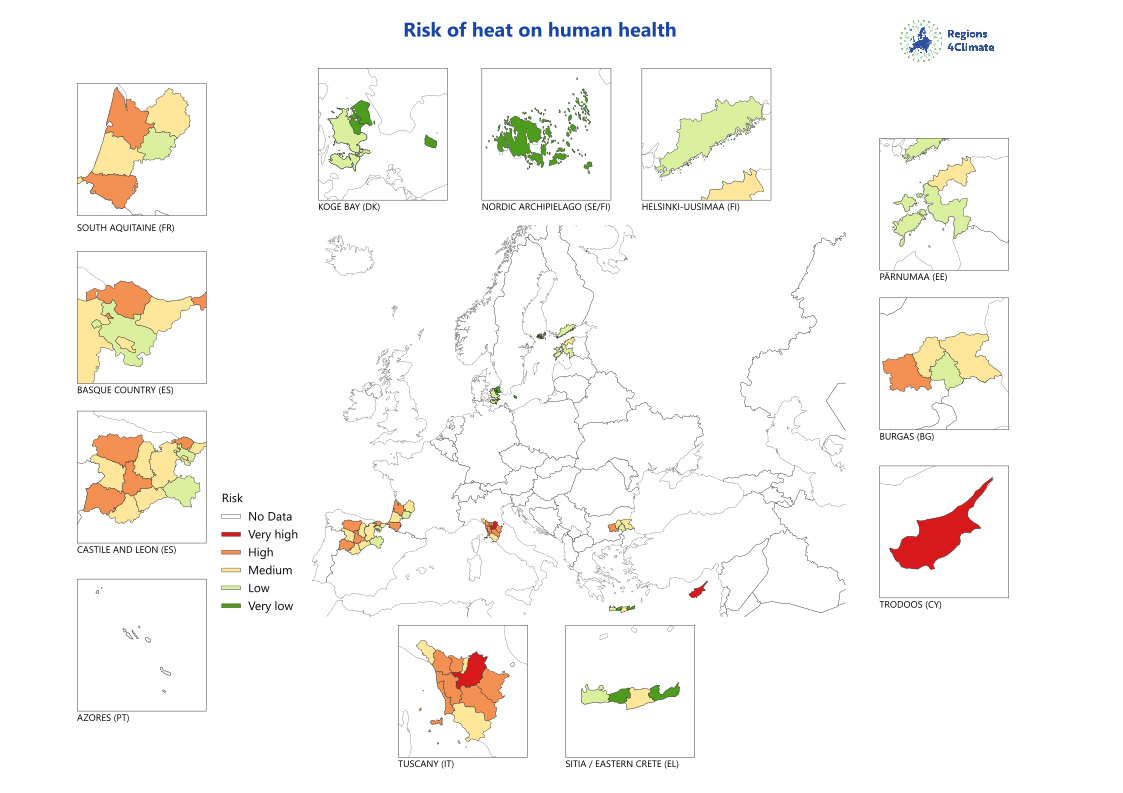
The EU-level vulnerability and risk maps identify where climate pressures are most significant. These insights guide the selection of local interventions in each pilot region where solutions are developed and tested.
Each region follows the pathway from understanding risks to implementing solutions, creating a portfolio of tested approaches that can be adapted and replicated elsewhere.
Partners and consortium
The project brings together regional authorities, research institutions, innovation partners, and local stakeholders across Europe.
Meet the consortium Belgium
 Bulgaria
 Cyprus
 Denmark
 Estonia
 Finland
 France
 Germany
 Greece

 Evidence base
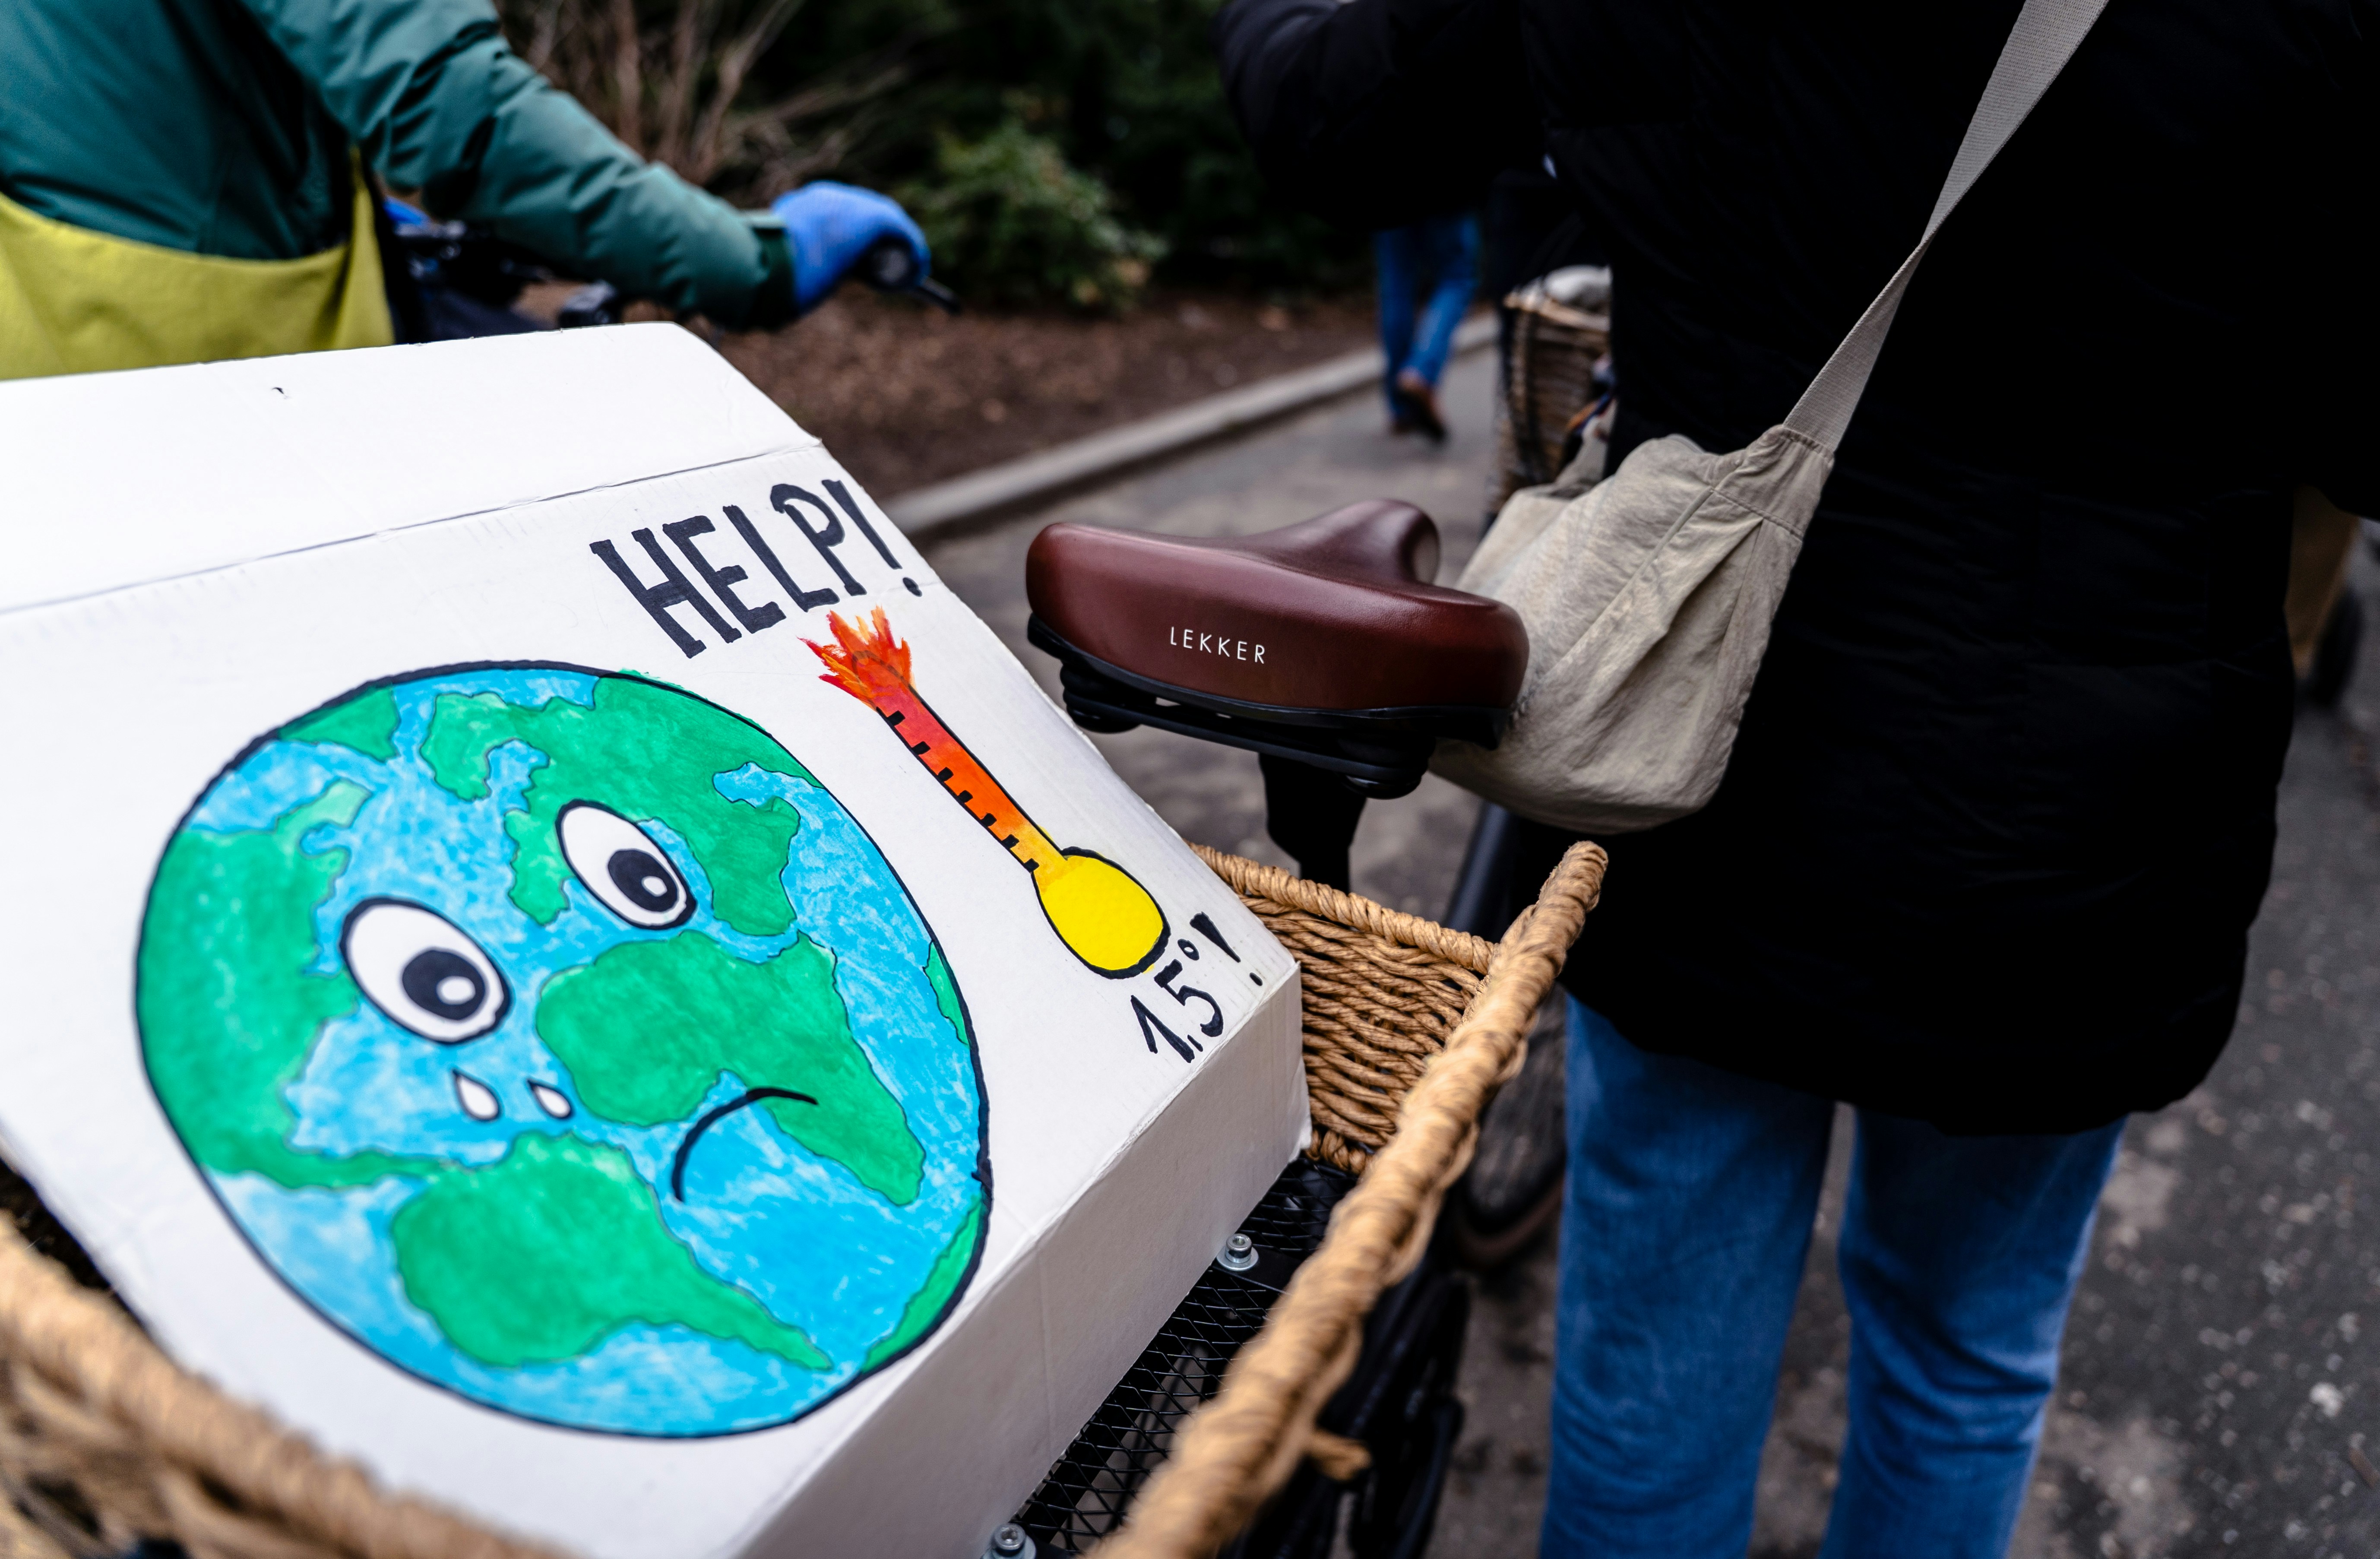 Stakeholder design
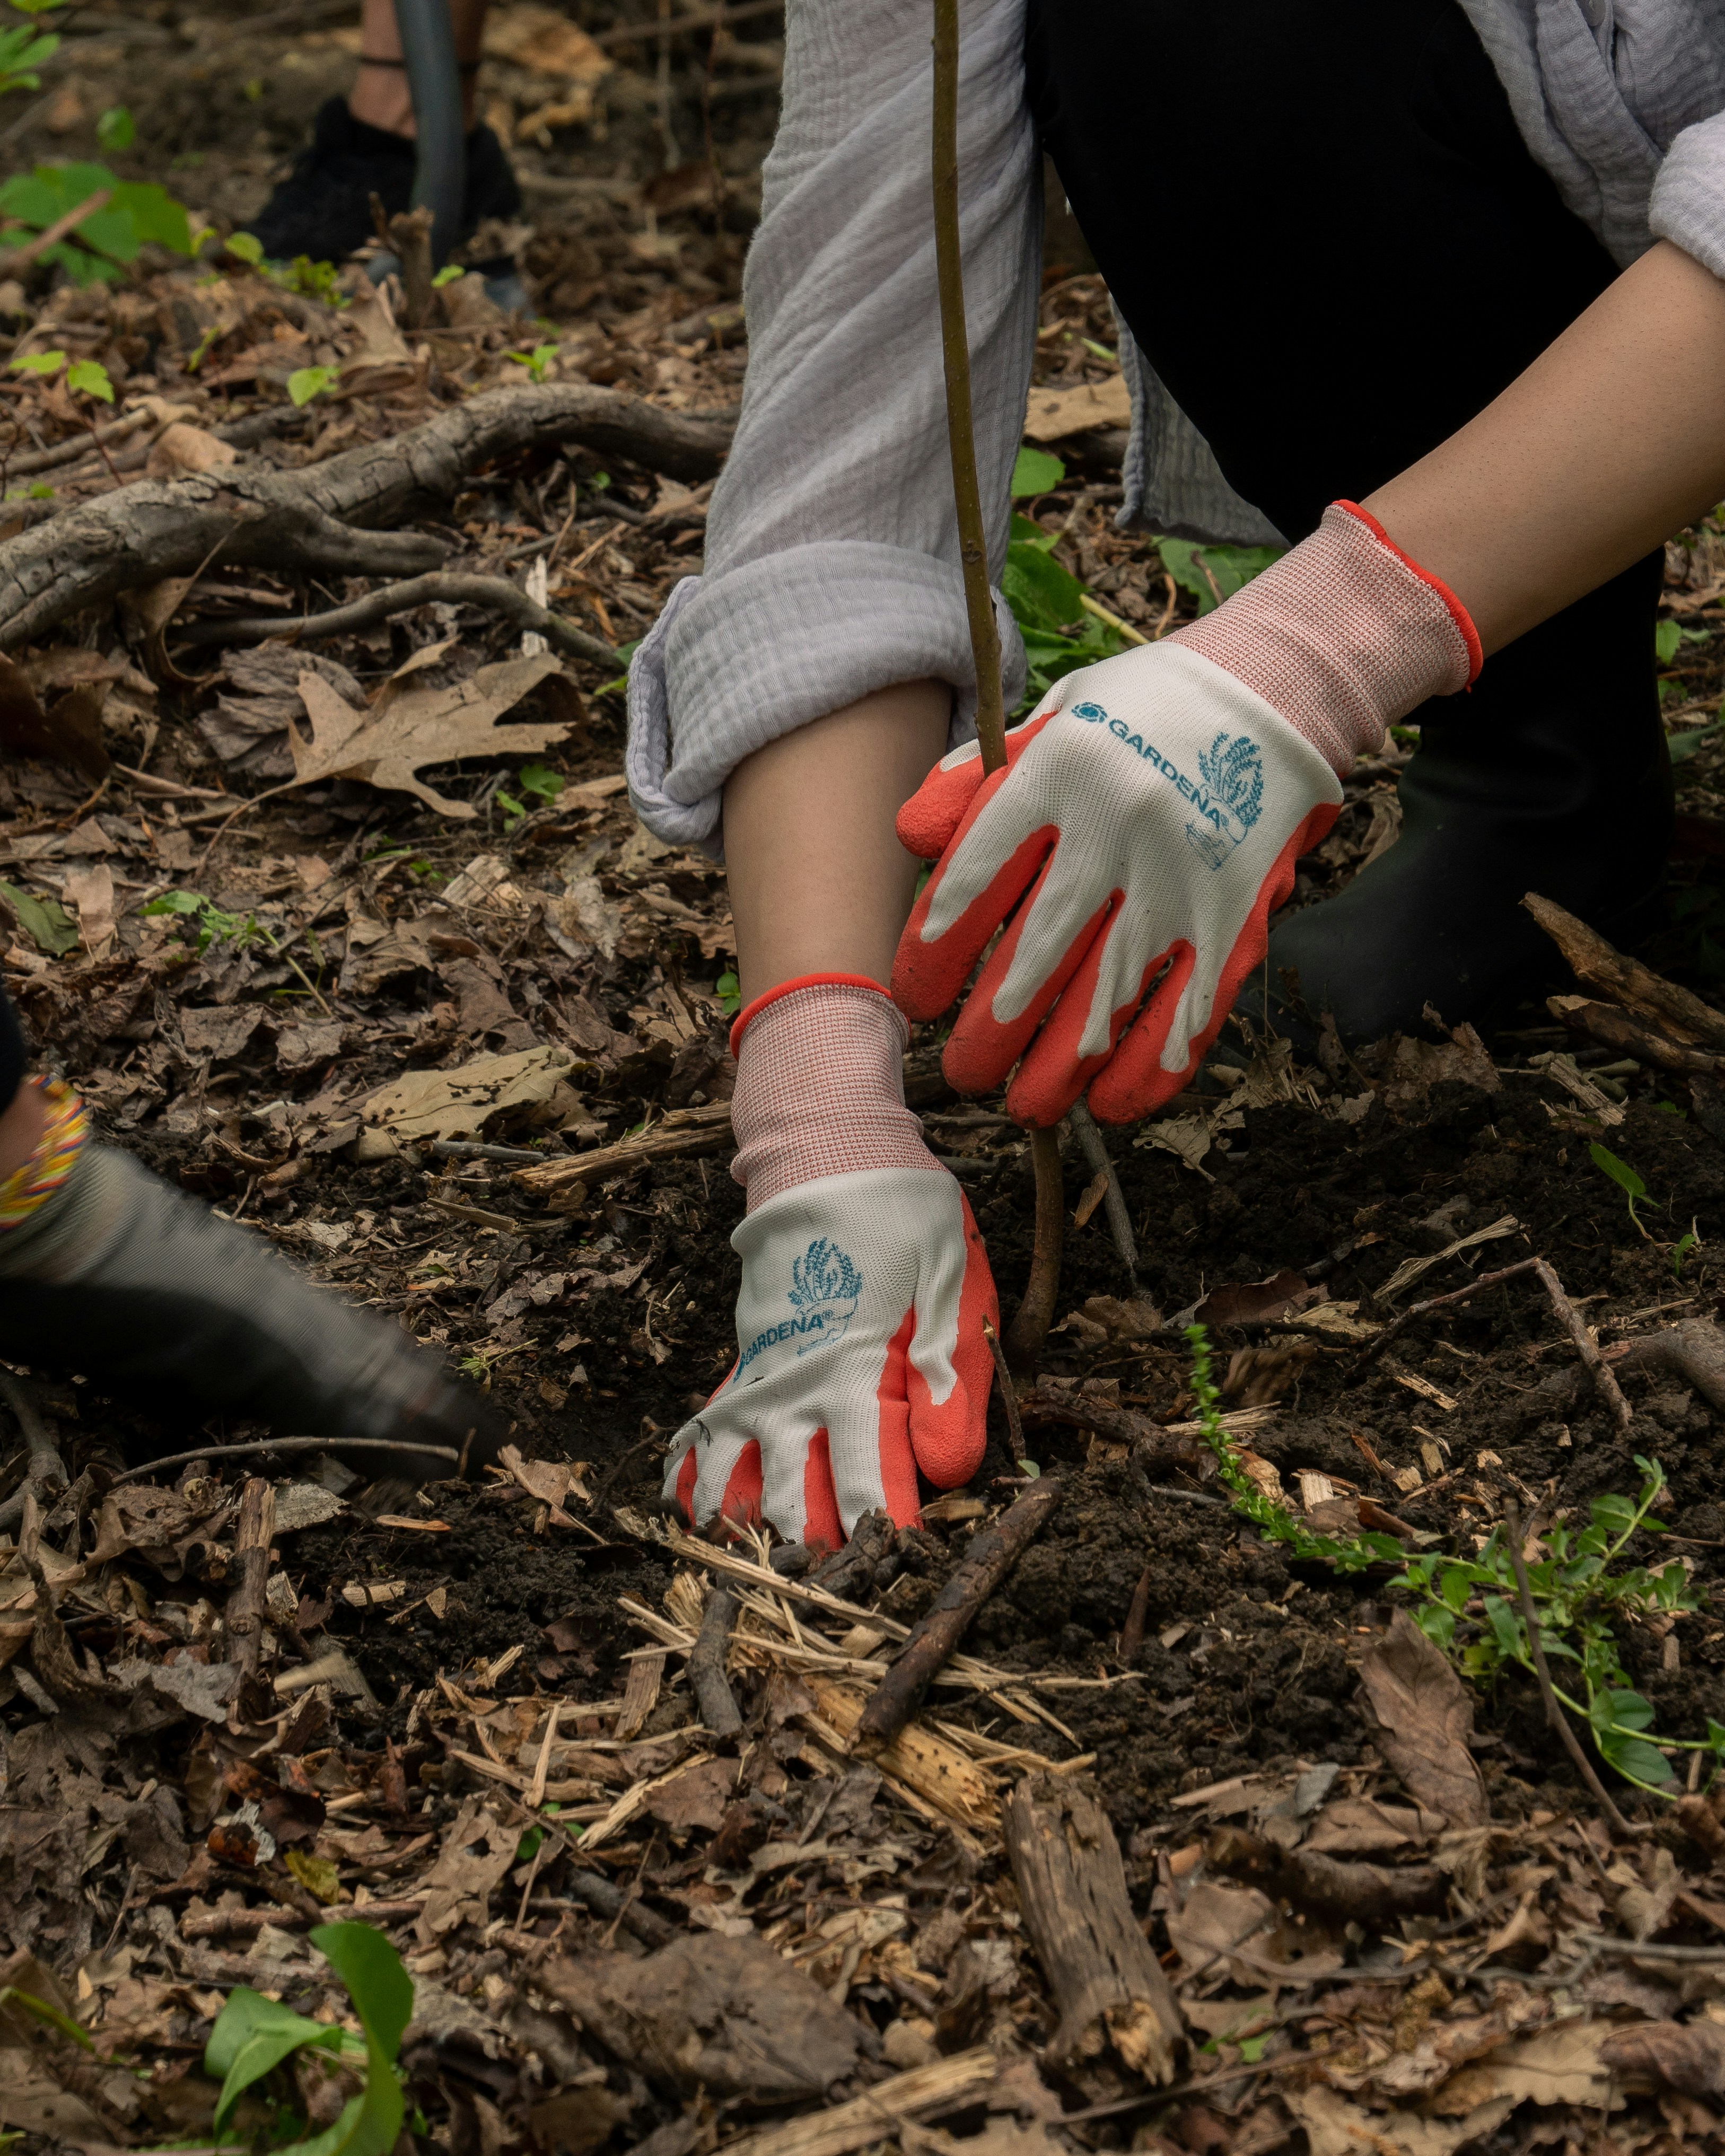 Demonstration sites
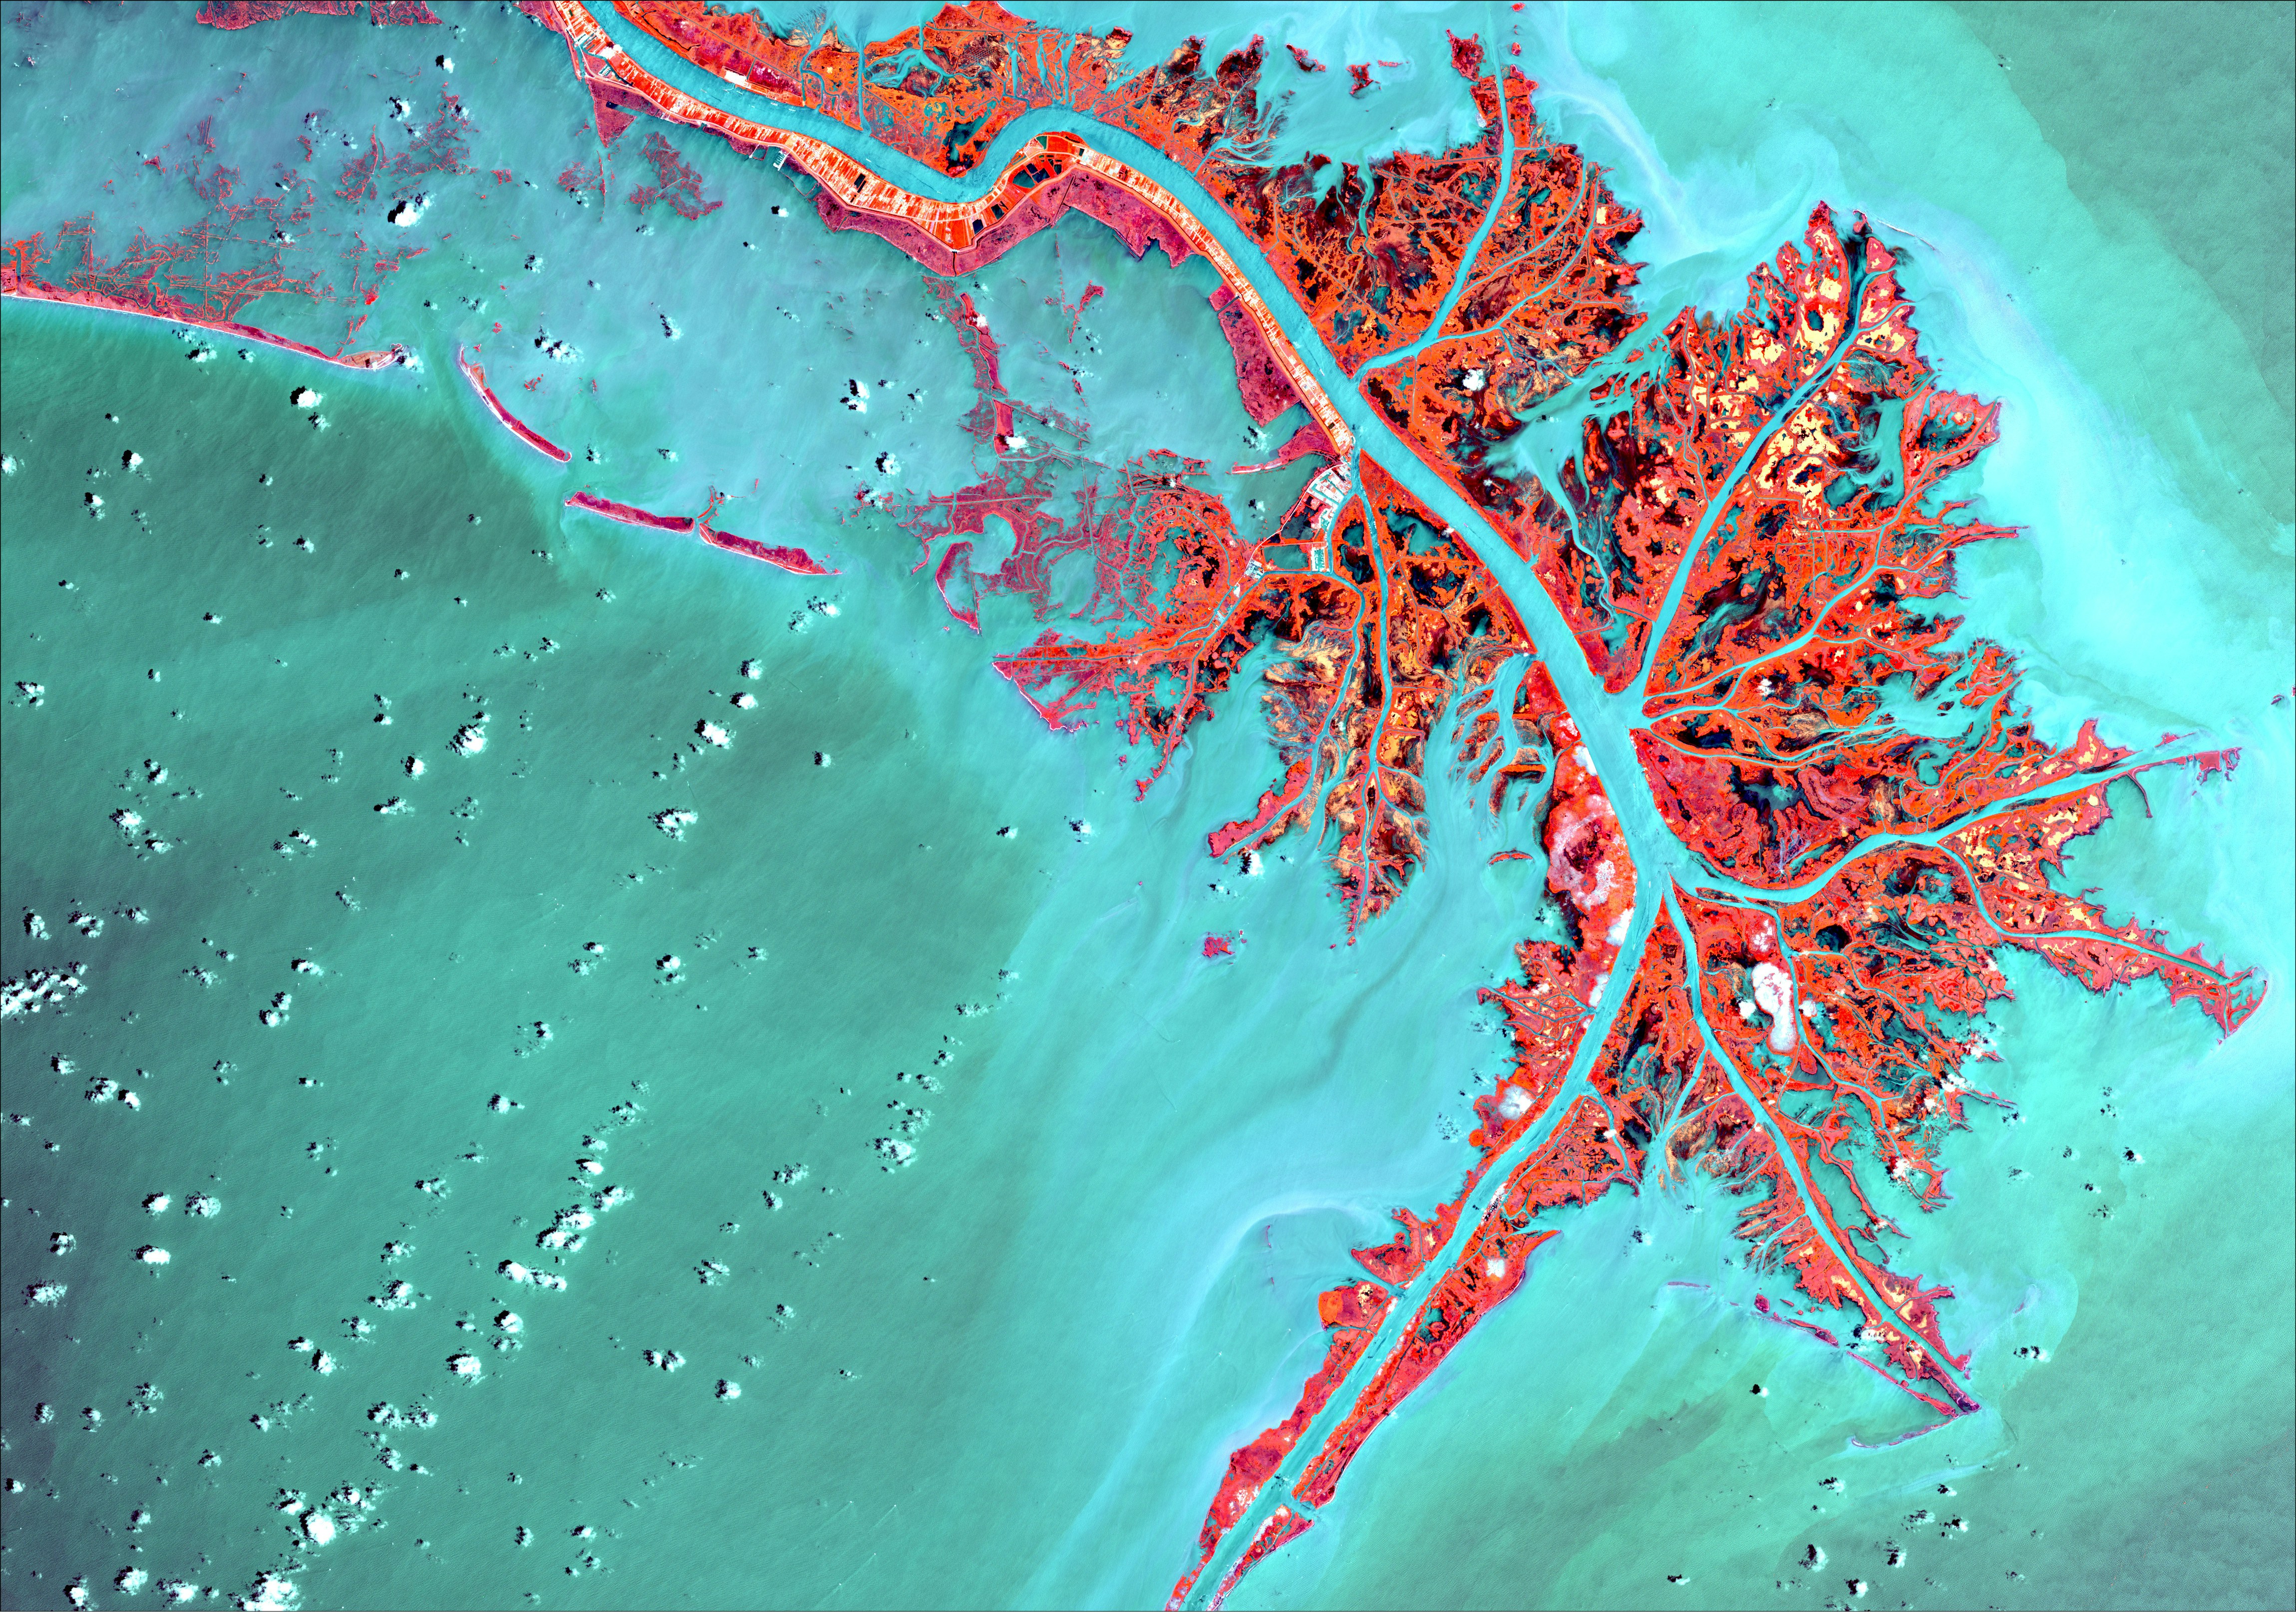 GIS Story Maps